The Hottest VC Trends – The Numbers from 2020
Numbers and studies about the state of the VC and technology growth market in 2020 are coming out at a fast pace and, adhering to tradition, we have again looked at reams of data and we’ve done some of the heavy lifting for you. We’ve:
- Compiled some of the most interesting numbers
- Added some of our conclusions and predictions
In this post, we will discuss VC activity and exit numbers based on 2020 statistics. In the next blog post, we will present some predictions for 2021. (To see our analysis of 2019 and predictions for 2020, see this and this entry.)
A Record Year for Venture Capital
Despite the COVID-19 pandemic, global VC activity reached record levels in 2020:
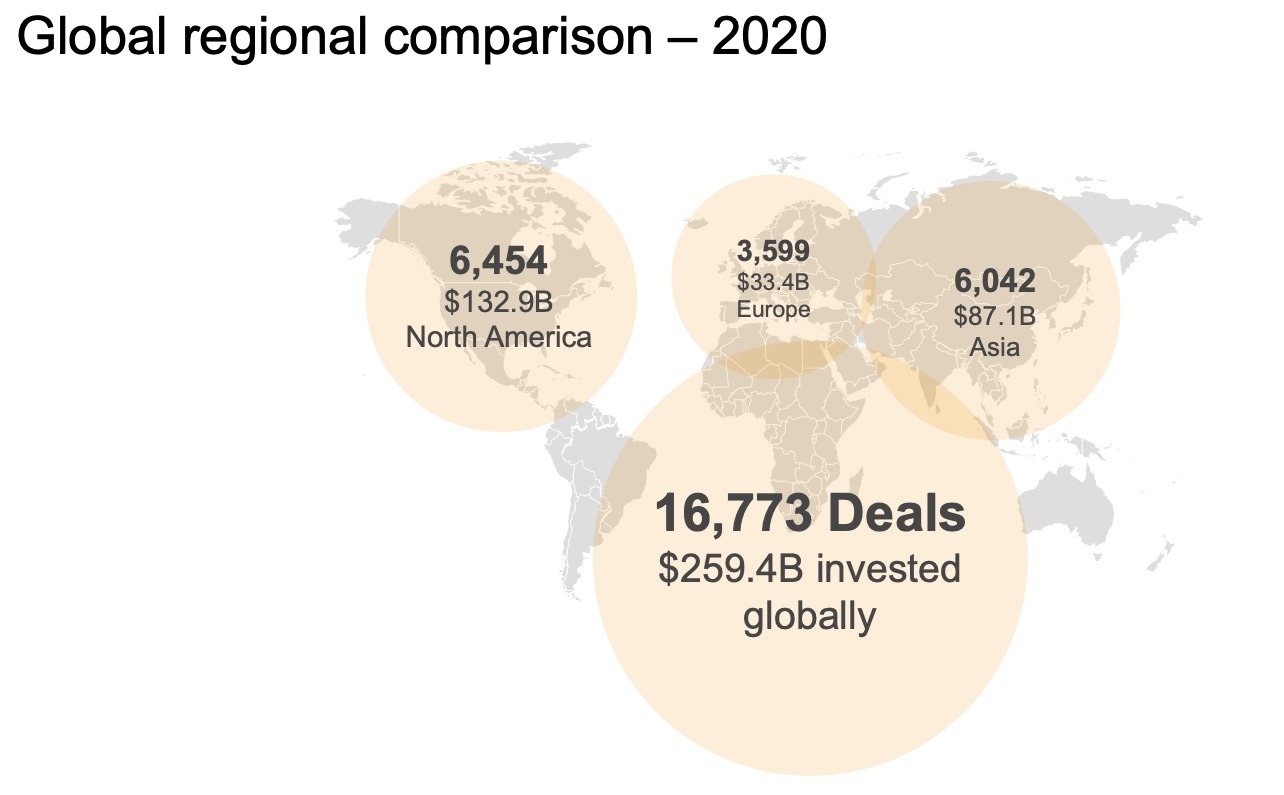
The US still clearly dominates in invested VC dollars and Asia has taken over Europe – both in dollars and # of deals
Source: PwC/CB Insights MoneyTree™ Report Q4 2020
The total dollar amount in VC investments globally was USD 260 billion, roughly 15 percent more than 2019. The total number of deals globally shrunk by roughly 7 percent, which translates into a larger average deal size.
The Big Picture
The developments in 2020 reinforce some of our key observations about the past several years.
Europe is Biting Asia’s Dust
Not surprisingly, North America again lead the VC pack with just over 50 percent of the global investment dollar volume. California alone is ~50% of the US VC volume and 25% of the global volume in dollars!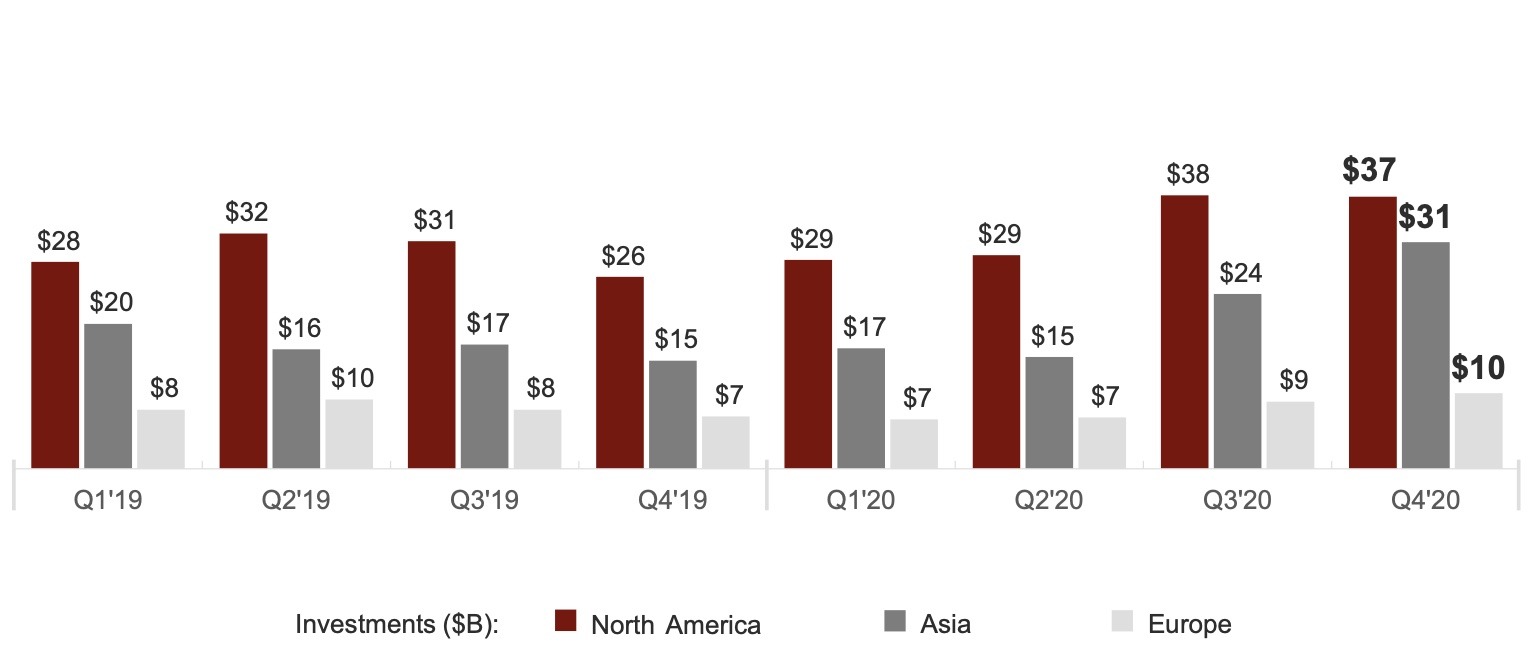
Quarterly deal volume by region in 2020.
Source: PwC/CB Insights MoneyTree™ Report Q4 2020
Europe is treading water, and Asia surpassed us already five years ago. Based on 2020 numbers, the European VC activity represents about 21.5 percent of the deals but just 12.9 percent on the total dollar value of investments. A key contributor to this trend is the small average size of European investments: the mean size of investments here is roughly USD 10 million, while it is 15M in Asia and 20M in the US.
US is flat on the number of VC deals
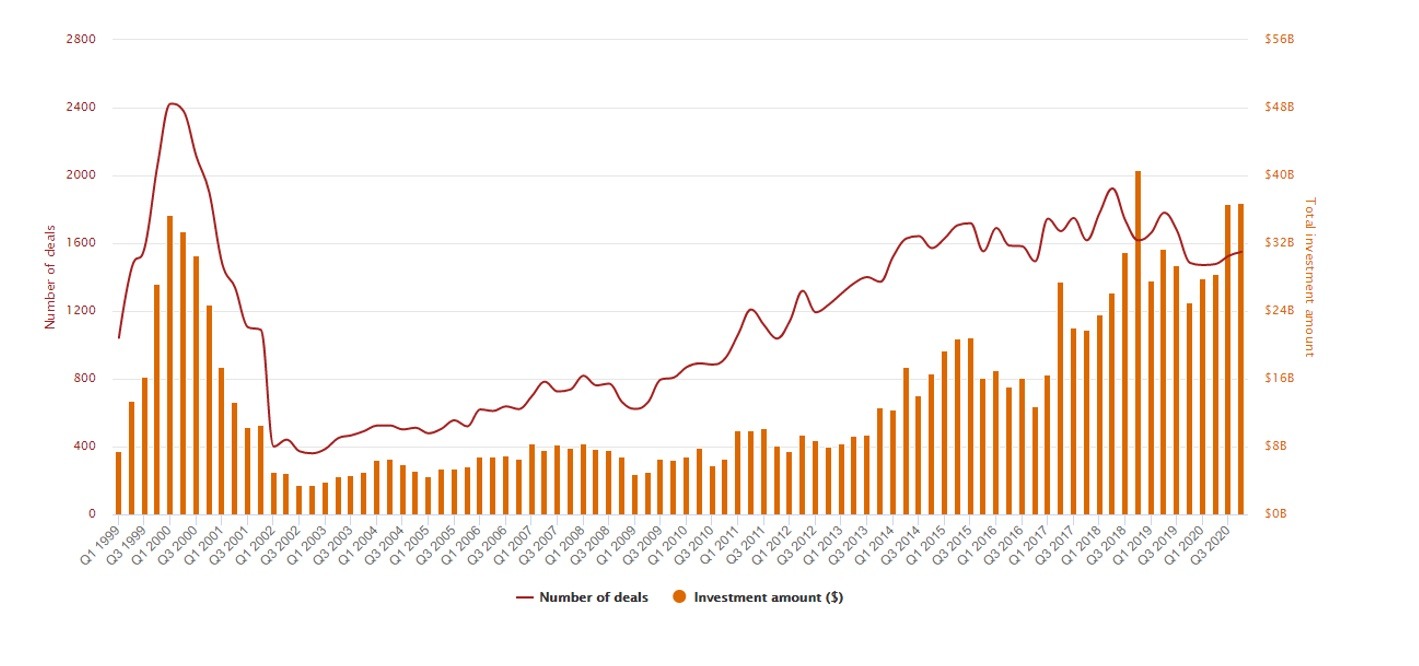
The US VC dollar volumes have grown steadily since 2003, but the number of deals is are no more growing.
Source: PwC/CB Insights MoneyTree™ Report
As the graph indicates, the dollar volume of US VC investments has grown steadily since 2003 (after the dot.com era and the following nuclear winter) and the dollar volumes are now actually above the 2000 levels. But the number of deals is still far below the dot.com era levels and there has been no real growth in deal numbers for the last six years.
The US volume growth is driven by megadeals
Especially the US market was driven by the so-called mega-rounds (rounds of over USD 100 million). The number of these mega-deals grew by nearly 50 percent and the dollar amount represented almost 50 percent of all VC investments.
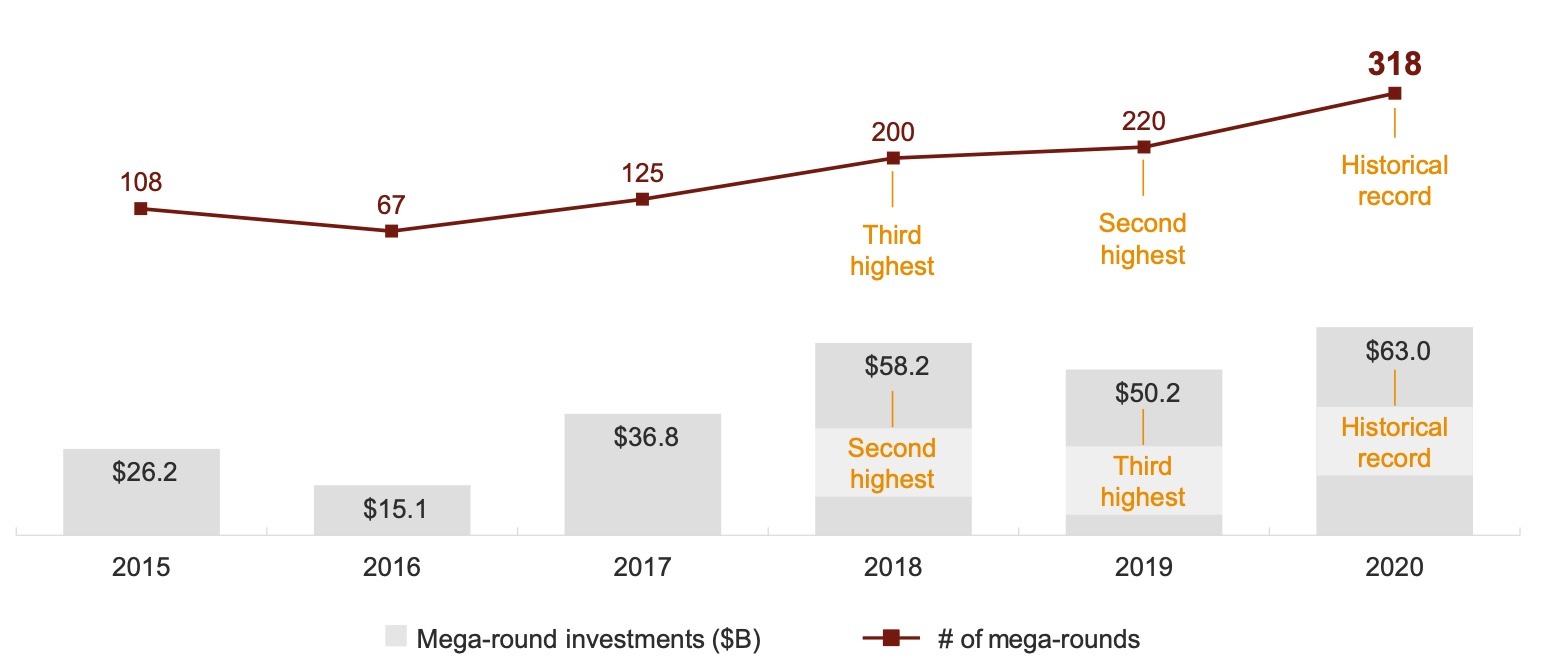
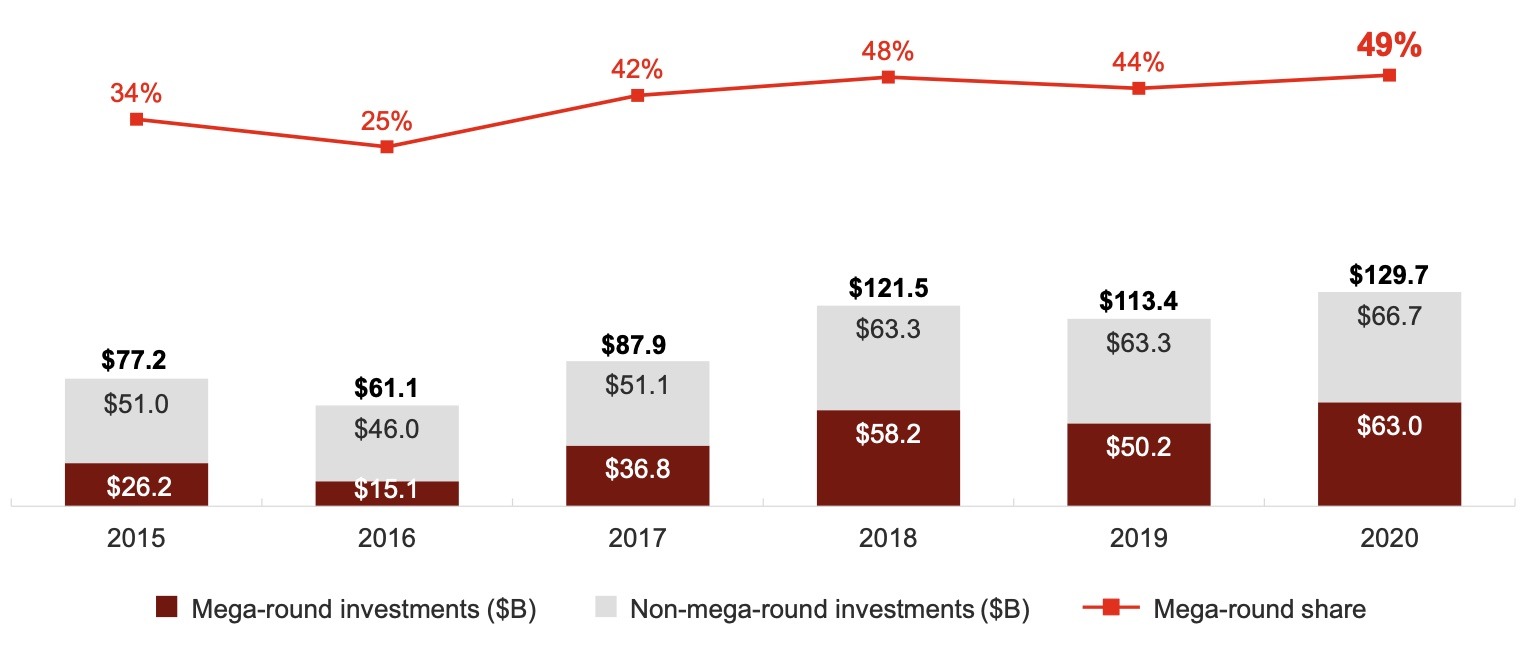
Megarounds dominate the US VC market: the dollar volume growth is generated almost purely by megarounds
Source: PwC/CB Insights MoneyTree™ Report Q4 2020
This poses a dilemma to the stat-heads: should these megadeals be counted as VC investments or should they be categorized separately from the other VC activity?
The Most Active Sectors and Verticals
The top five sectors pulling in the most investment dollars (in the US) were not a big surprise.
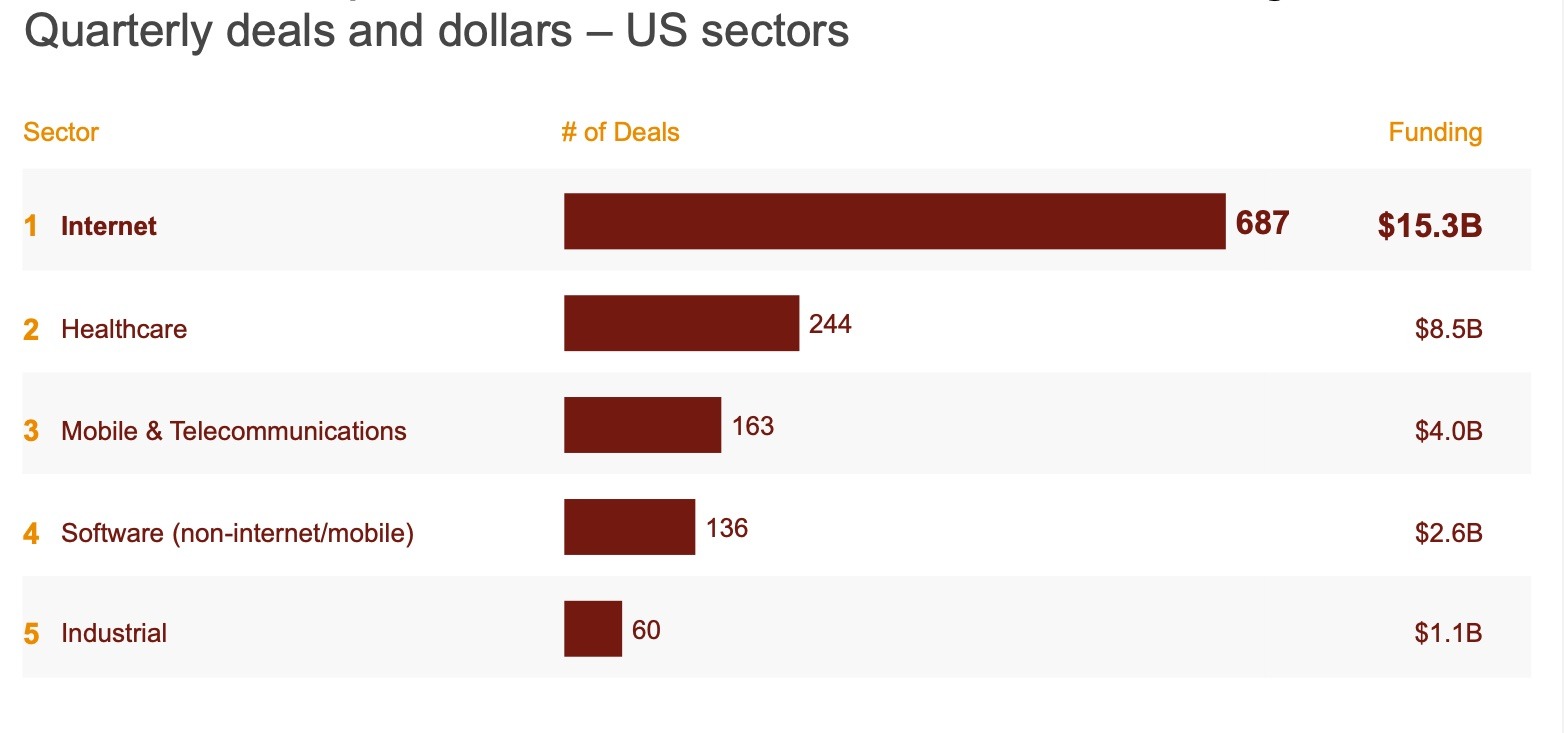
ICT is still the king of the hill, lead by Internet-related investments.
Source: PwC/CB Insights MoneyTree™ Report Q4 2020
ICT in different forms (SW, HW, telecommunication) fully dominates the US VC industry – as always.
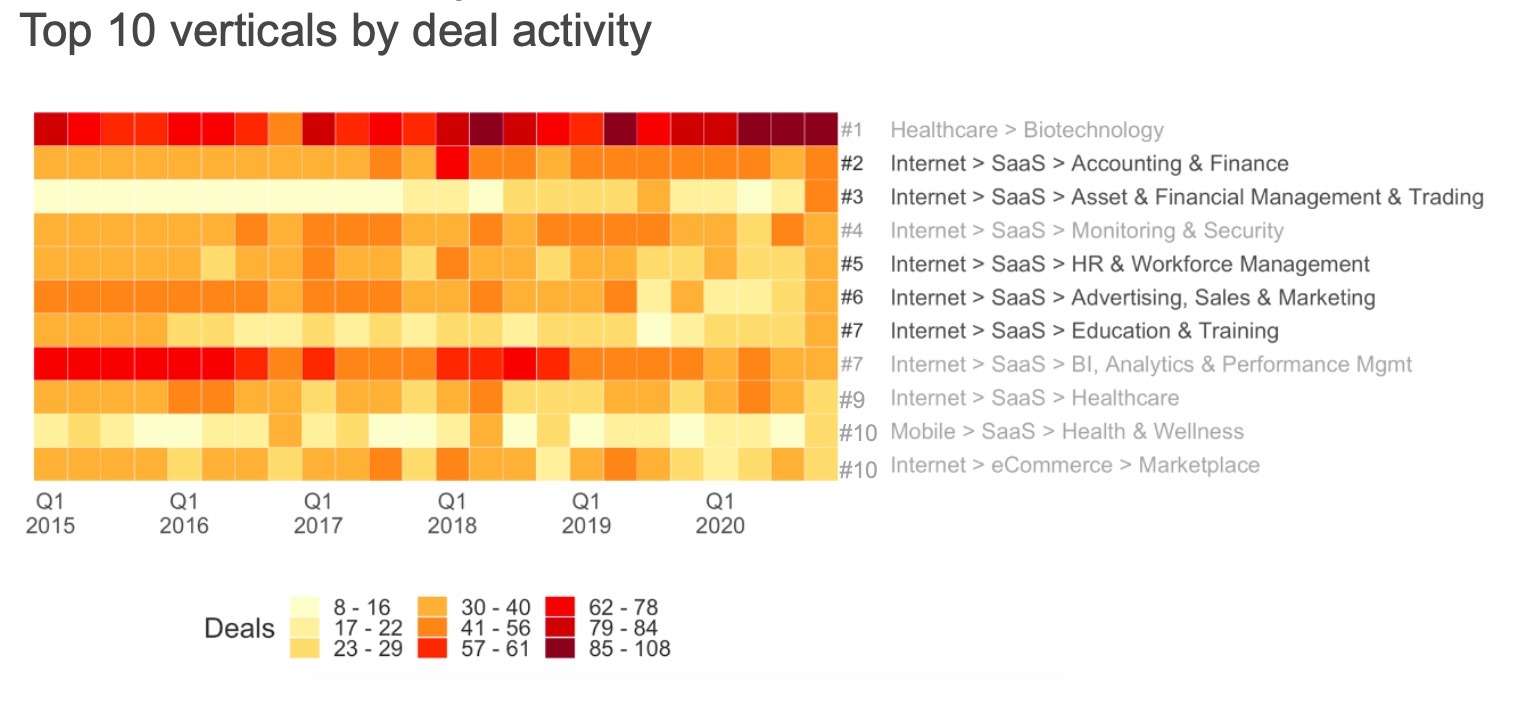
SaaS is the name of the game in ICT.
Source: PwC/CB Insights MoneyTree™ Report Q4 2020
When we look at a more granular picture and compare the sub-verticals, we get further confirmation that SaaS is the de facto standard business model for ICT companies in the startup playbook.
A massive rebound of exits in H2 2020
The exit market started slowing down in late 2019 and the trend continued in the first half of 2020 – but there was a massive rebound in the second half of 2020.
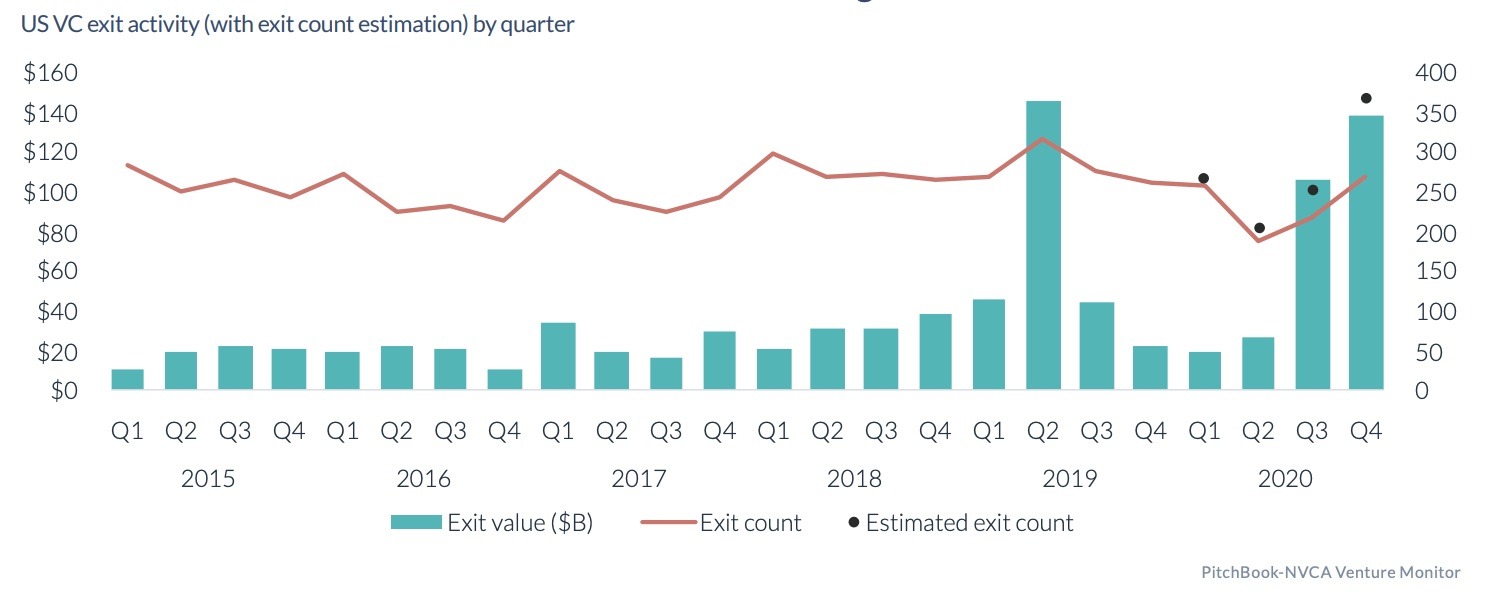
Exits came back with a vengeance in the second half of 2020.
Source: Q4 2020 PitchBook NVCA Venture Monitor
Q3 and Q4 of 2020 turned out to offer an exceptionally good exit market for VC funded companies:
- There was a record number of IPOs: 450 (including 248 SPAC IPOs with $83.214M proceeds)
- The VC Exit market was very healthy as acquirers spent $604 billion on 3,993 global tech targets, compared to $476 billion on 3,729 targets in 2019. In fact, If the feverish activity levels of the second half of 2020 hold during 2021, we may be looking at the first trillion-dollar VC Exit year.
- Many VC funded companies were sold to larger Private Equity funds
Word of the Year: SPAC
If one followed the US IPO market at all during the year, it was difficult to avoid the word SPAC – everybody seemed to be talking about them. SPACs (Special Purpose Acquisition Companies) are publicly traded shells created to merge with a privately held business, giving the takeover target a ready-made listing without having to stage an initial public offering.
Once dismissed as a shady Wall Street relic, SPACs have become the hottest tickets in mergers and acquisitions. (In an industry with strong herd instincts, it isn’t much of a stretch to say that nearly anyone who’s anyone has one.)
The data backs this observation up:
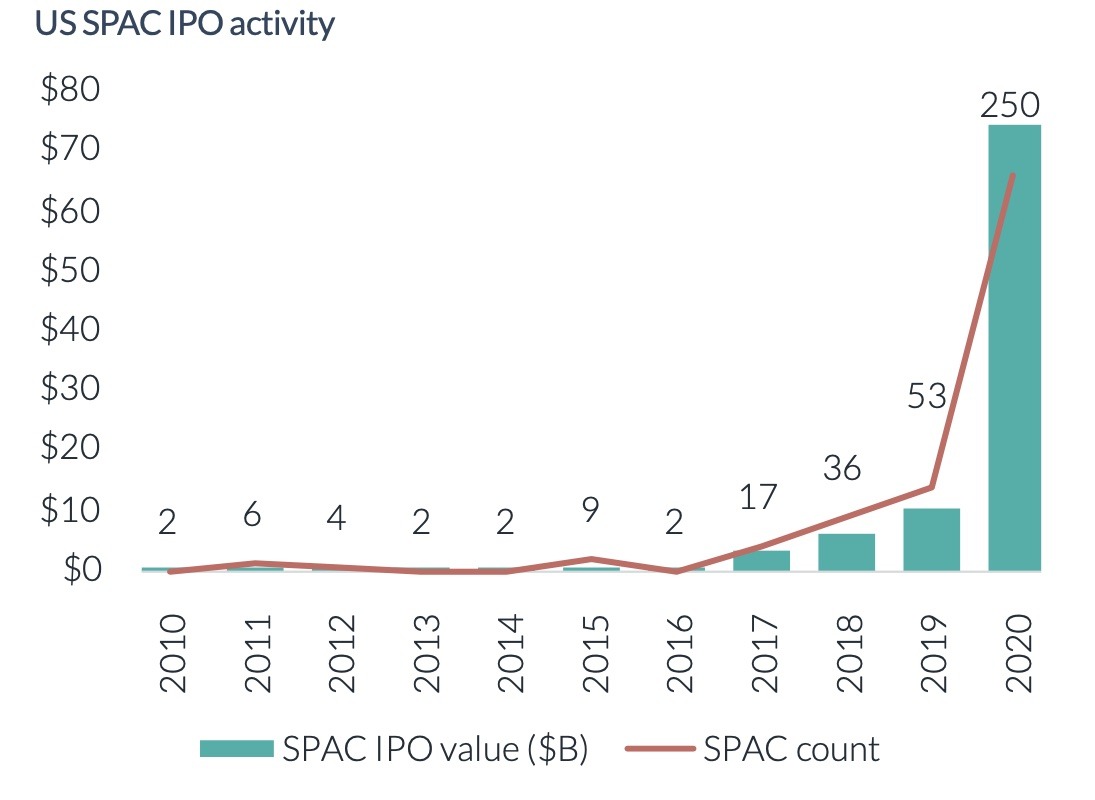
The number and volume of SPAC IPOs exploded in 2020. The trend has continued in early 2021
Source: Q4 2020 PitchBook NVCA Venture Monitor
The year 2020 has clearly been a record year for SPACs: the number of SPAC IPOs grew by a factor of 5, with the proceeds growing nearly ten-fold. As a matter of fact, more than 50% of US tech IPOs in 2020 were SPAC-based (248 out of 450)!
If you wish to read up on the SPAC phenomenon and some of its potential dangers, we recommend this detailed SPAC article from Digits to Dollars.
Fundraising Surged – But Only in Dollar Volume
Global fundraising activity surged to $112 billion in 2020 from $90 billion last year, in part due to the increasing focus on mega funds (defined as funds in excess of $1 billion raised).
In Q4’20, VC firm Andreessen Horowitz raised two mega-funds worth $4.5 billion in total – a $1.3 billion fund with early-stage companies focused on fintech, consumer, and enterprise solutions and a $3.2 billion fund focused on a broader array of growth-stage companies. In part, this reflects the move of larger investors to put their capital into the hands of proven fund managers with a track record of high returns from their funds.
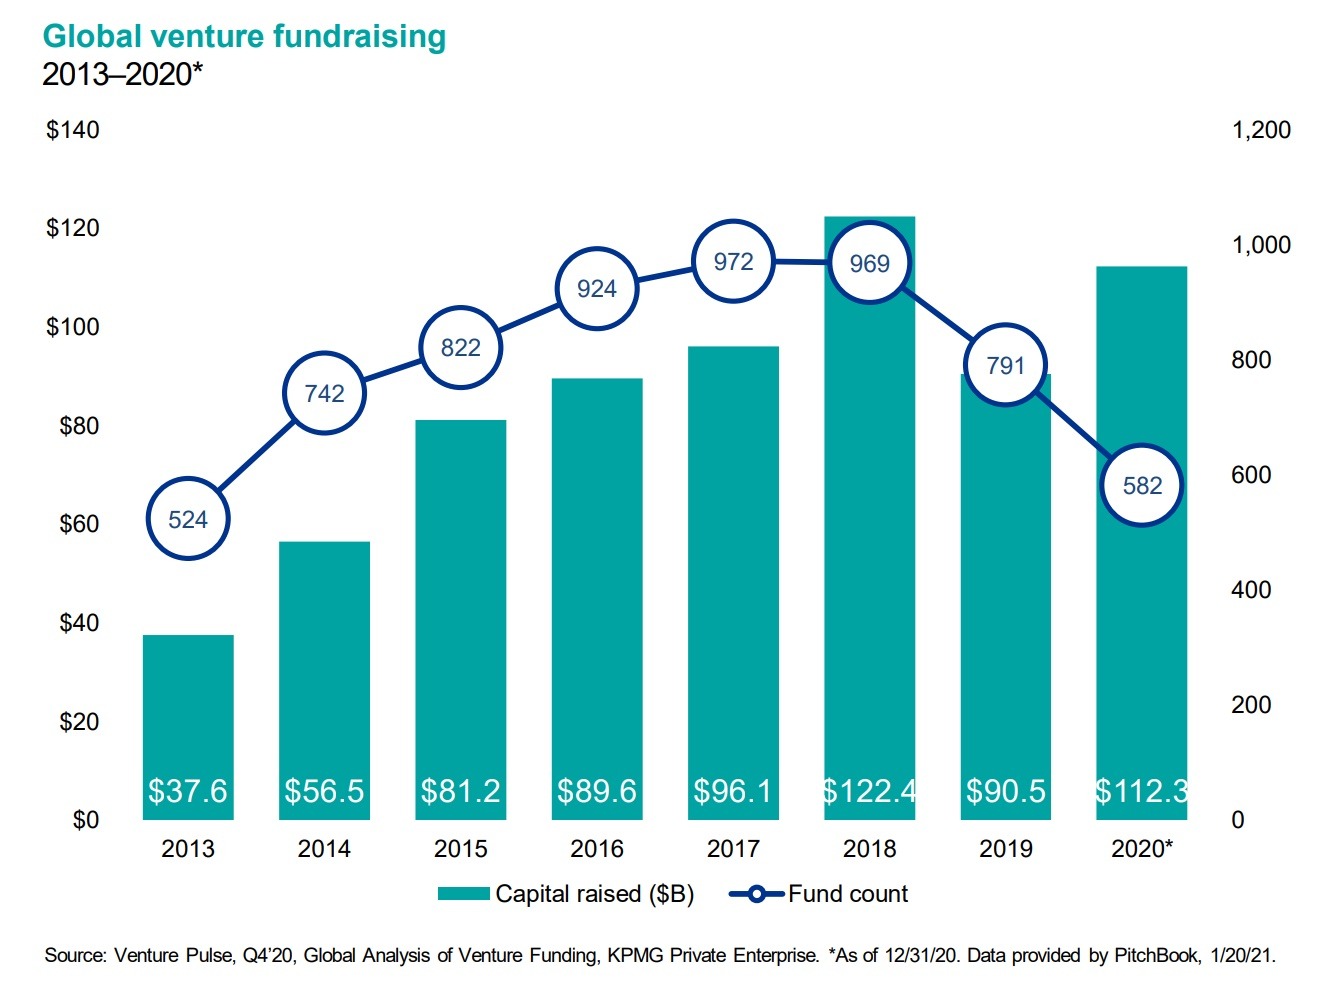
The number of new funds is down dramatically, but they are substantially bigger on average – megafunds looking for megadeals
Source: KPMG Venture Pulse Q4 2020.
However, due to the megafund trend, the number of funds raising money was the lowest since 2013 – the market is getting more concentrated.
This is perhaps one factor that explains why the number of VC investments does not grow in the US: there is more and more money, but the growth is driven by very large funds that tend to look for very large deals. This leads to a few questions and observations:
- Will there be a need in the US at some point for more effective nurturing of the undergrowth?
- The situation in Europe is actually the opposite: early-stage funding is typically well taken care of but there are fewer local growth-stage investors
The Numbers in Summary
To our surprise, 2020 turned out to be a very good year on most fronts. While things slowed down in Q1 and Q2, the doomsday did not arrive. In fact, as the numbers above show, many records were set during the year – no doubt driven by the massive quantitative easing by central banks and the stubbornly low interest rates.
Stay tuned for our next blog where we offer some analysis and predictions for the coming year!
Tags: Nexit